
New, interactive technology helps ADWR make statewide data on land subsidence publicly available and easier to access
For many years, the Arizona Department of Water Resources has been a national leader in monitoring the impacts of land subsidence – the most visible consequence of large-scale groundwater depletion.
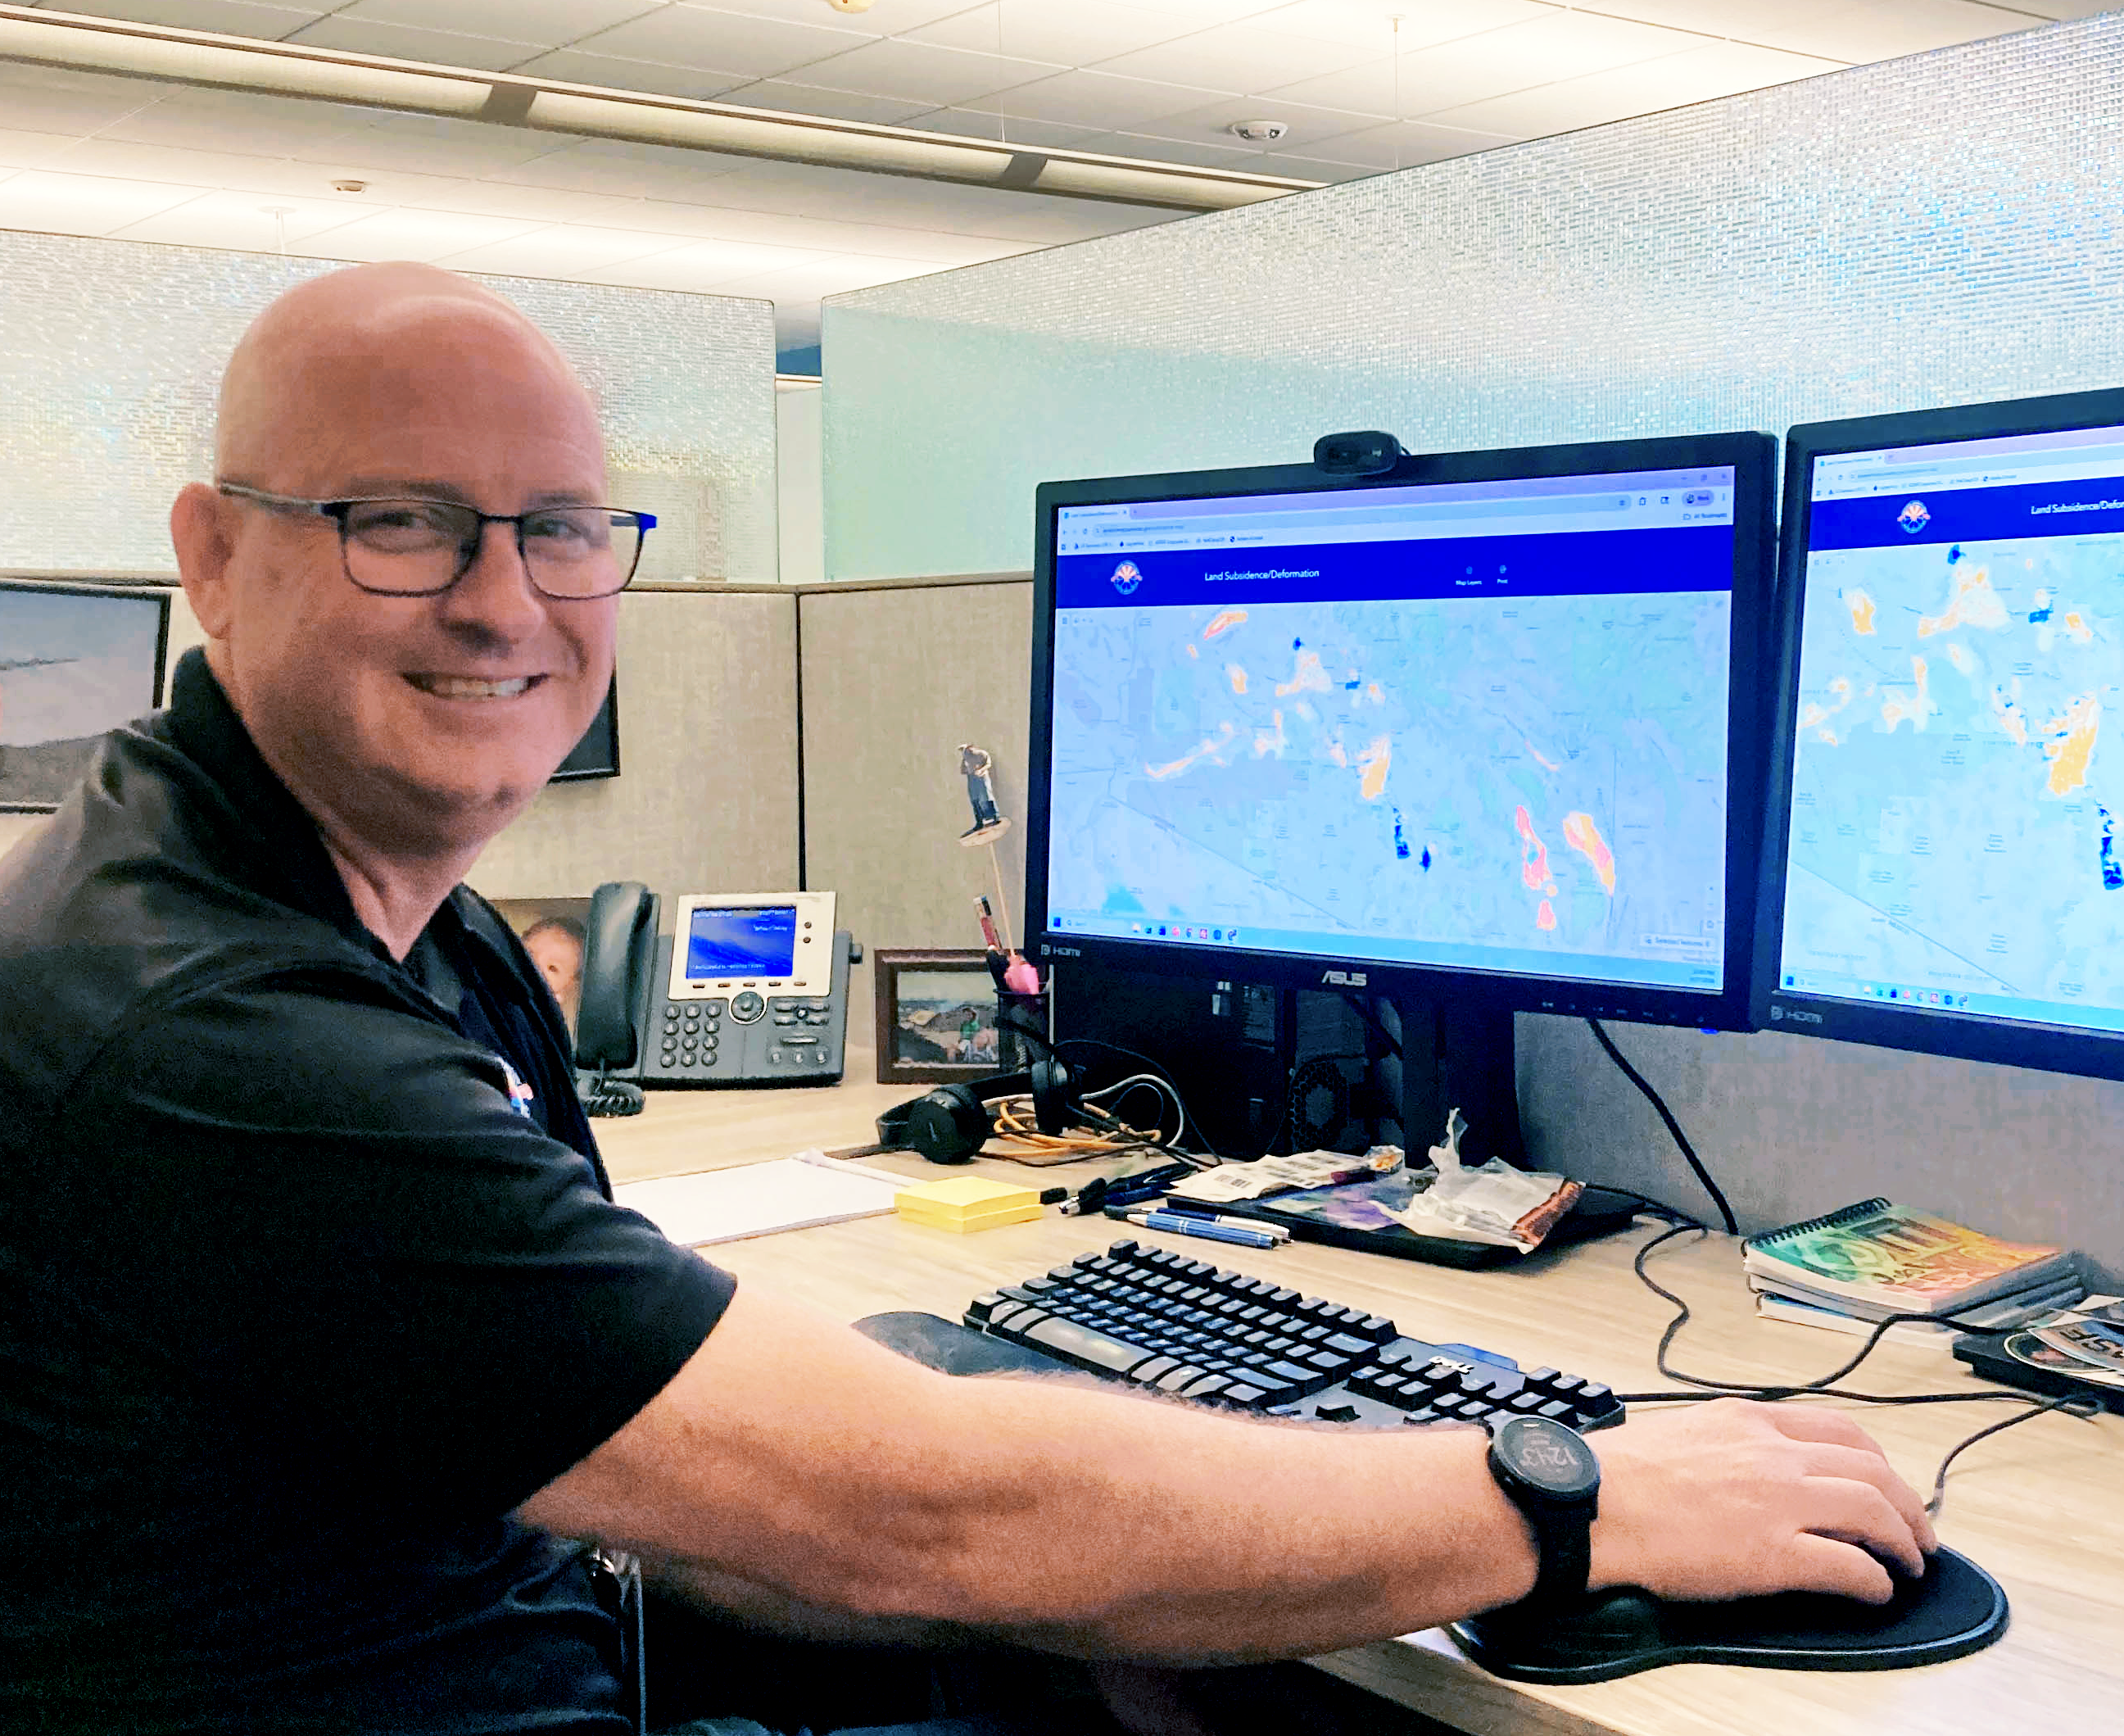
Led by the Department’s nationally recognized expert in subsidence and the technology that monitors it, Brian Conway, ADWR has sought to make our subsidence-monitoring data more publicly accessible. Recently those efforts have borne important fruit in the form of an interactive map on the ADWR website that allows users to access detailed information about land subsidence throughout most of the state.
ADWR long has published static PDF maps depicting subsidence in its various and increasing locations around the state. But advancements in interactive technology have provided opportunities to make the data even more accessible.
While the PDF maps have been a great resource and will continue to be a resource for monitoring land subsidence in Arizona, I have always wanted an interactive map similar to the (ADWR Groundwater Site Inventory, or GWSI) web map where we could combine all of our datasets to help end-users better understand the connection between land subsidence, earth fissures, groundwater levels and the rest,
said Conway recently.
Conway said that he has been working with the Department’s Geographic Information System (GIS) group for over a decade, working on the possibility of developing a land subsidence map for ADWR.
Higher priority projects, staffing, resources, and limitations with online mapping technology prevented that from occurring,
he recalled. However, this changed in the past year with advancements to the ESRI online GIS platform that ADWR uses for the online web maps and applications.
ESRI
is a reference to the Environmental Systems Research Institute, the global market leader in geographic information system (GIS) software, location intelligence, and mapping. ESRI is best known for ArcGIS, a comprehensive geospatial platform used to create, manage, and analyze geographic data - a platform that ADWR now employs to interactively depict an ever-increasing amount of its database.
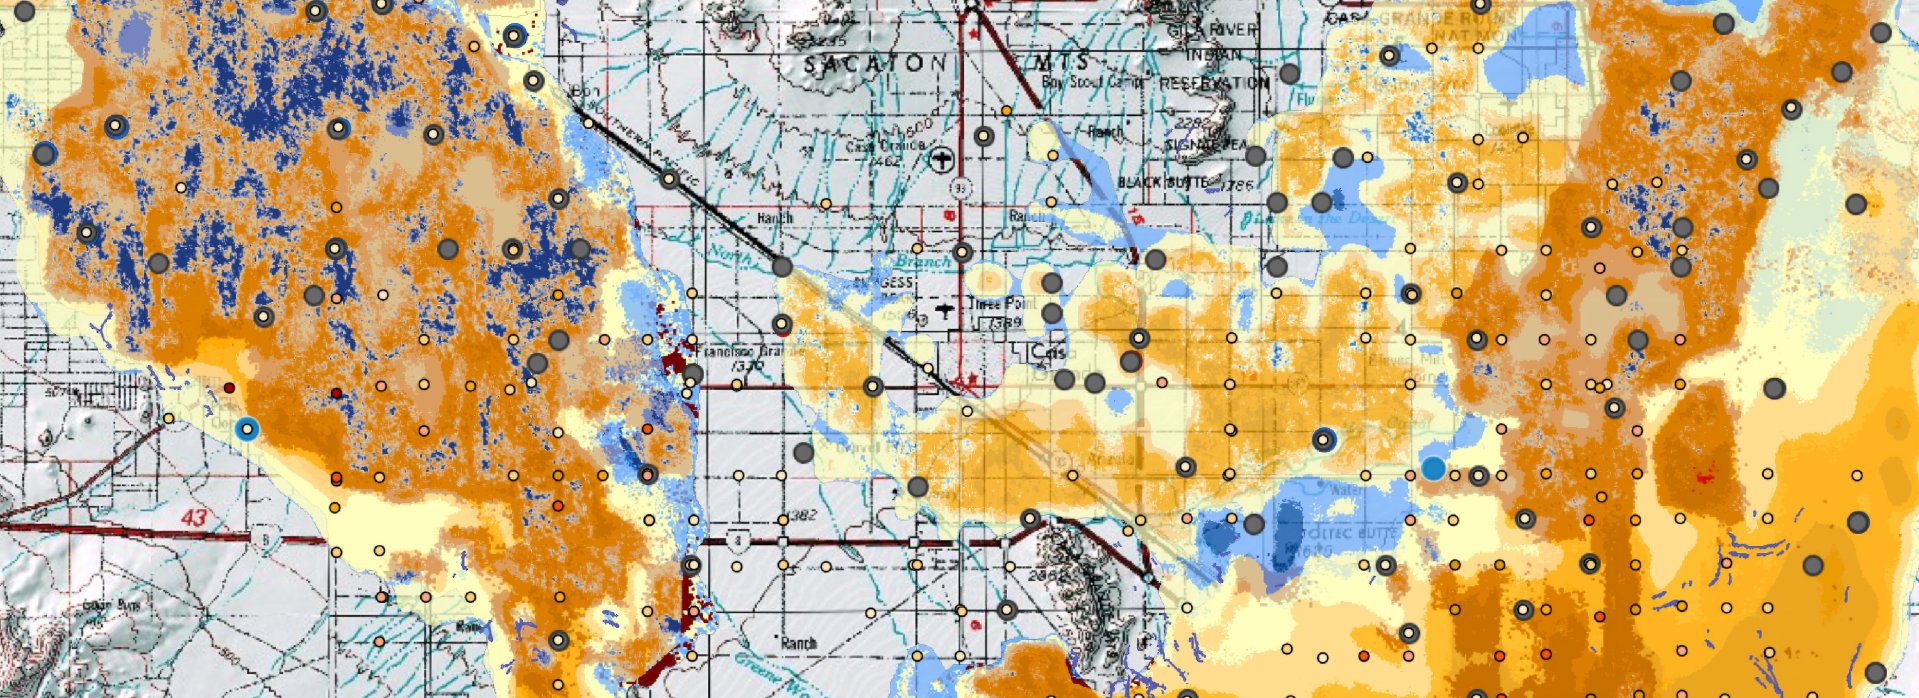
In 2018, ADWR published an Interactive story map
that employed high-tech InSAR imagery to depict the effects of land subsidence in the Willcox area. Now it’s the Department’s land-subsidence data is getting the ESRI/ArcGIS treatment to depict the impacts of subsidence statewide.
ADWR has been monitoring land subsidence since 1998 using survey-grade Global Navigation Satellite System (GNSS) measurements. In 2002, ADWR received a $1.3 million grant from NASA to develop its own InSAR program and to make it fully operational providing InSAR data both internally and externally which we successfully achieved, resulting in the first State-Agency operated InSAR program.
In 2008, ADWR started posting static PDF land subsidence maps every year to it’s website for end-user to easily access.
As a result of these advancements, I approached the GIS group about this project - which had been on their radar for the past two years - to start working on an online land subsidence map,
said Conway.
When the opportunity finally arrived, I jumped at the chance to work with the GIS group on creating an online Land Subsidence/Deformation Map.
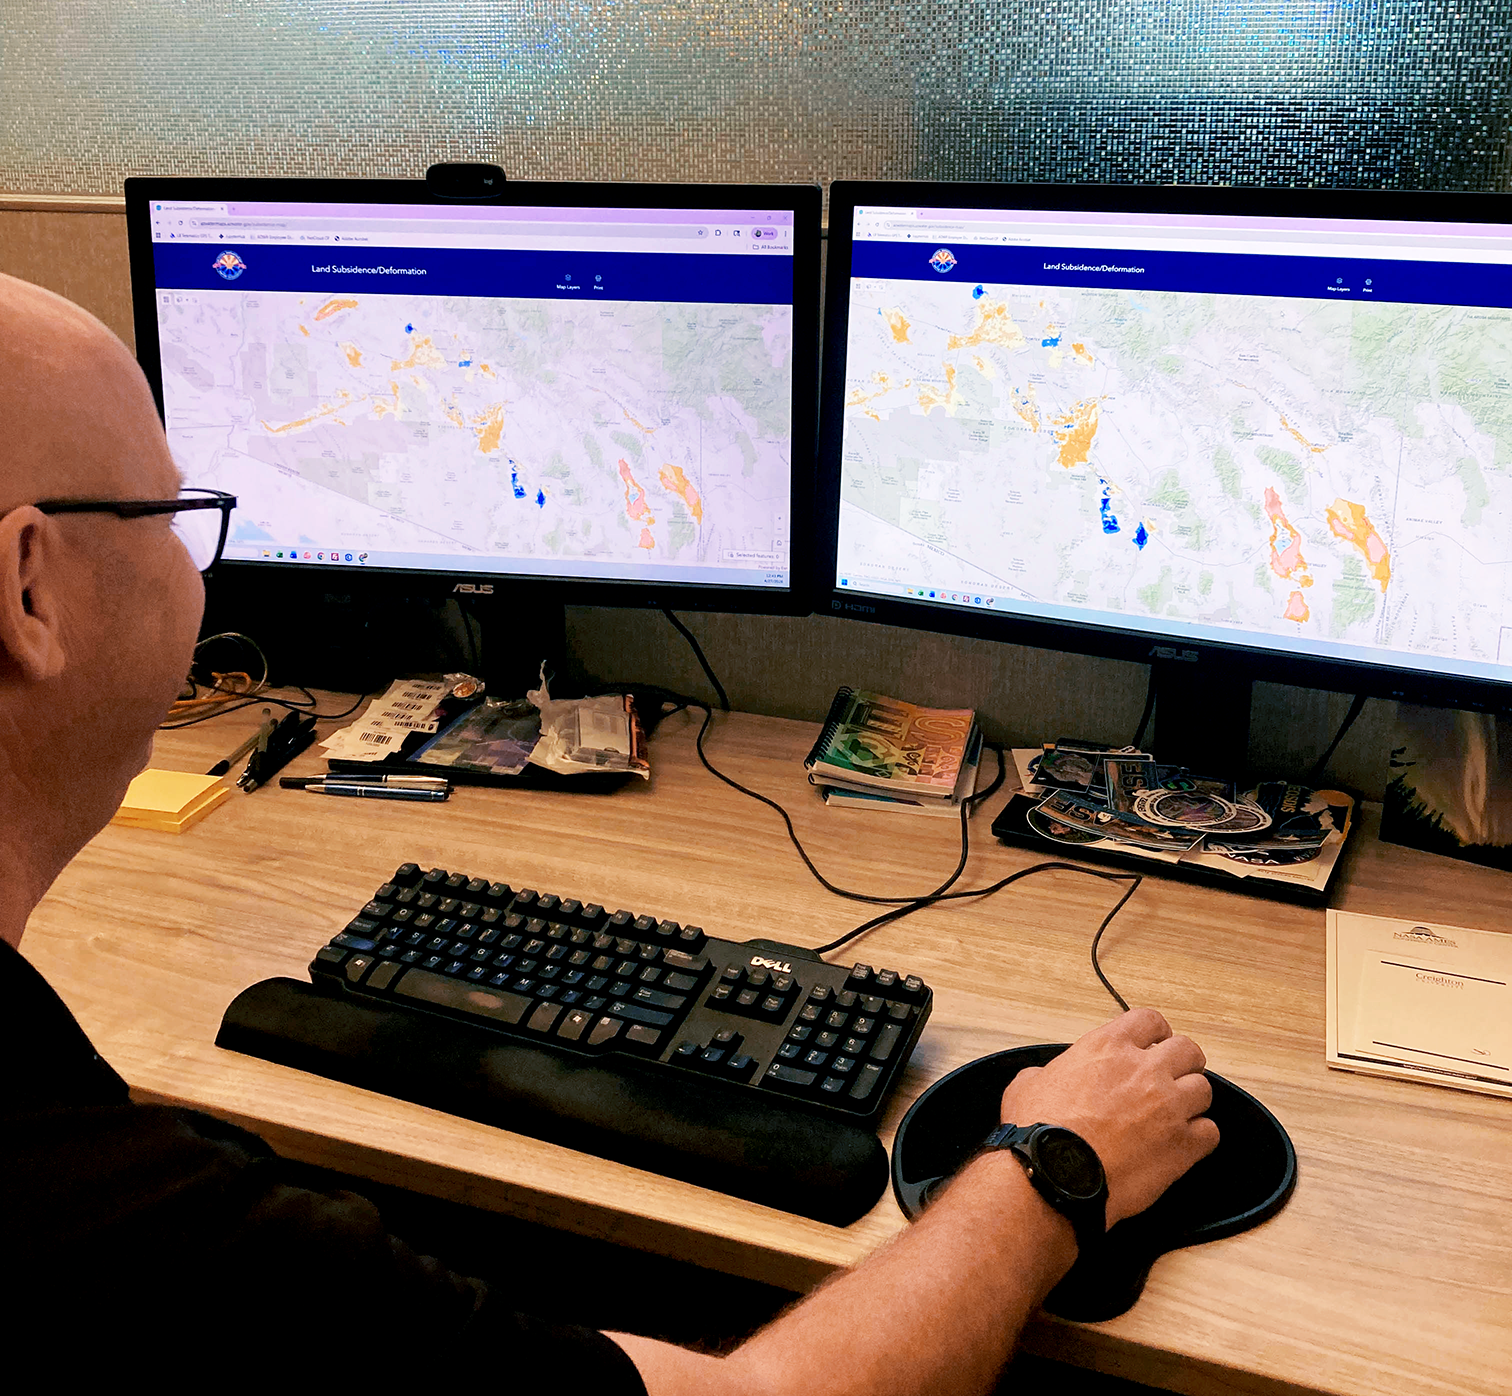
Conway credits ADWR GIS Senior Analyst David Waltz with doing all the heavy lifting
in creating the interactive map.
David worked with ESRI and others to get the InSAR data to display correctly in the application since this was a first time for the GIS group working with the data in the web application format,
said Conway.
Waltz recalled that there was a bit of trial and error that occurred in setting up the data,
since some data sets allowed for showing greater detail than others.
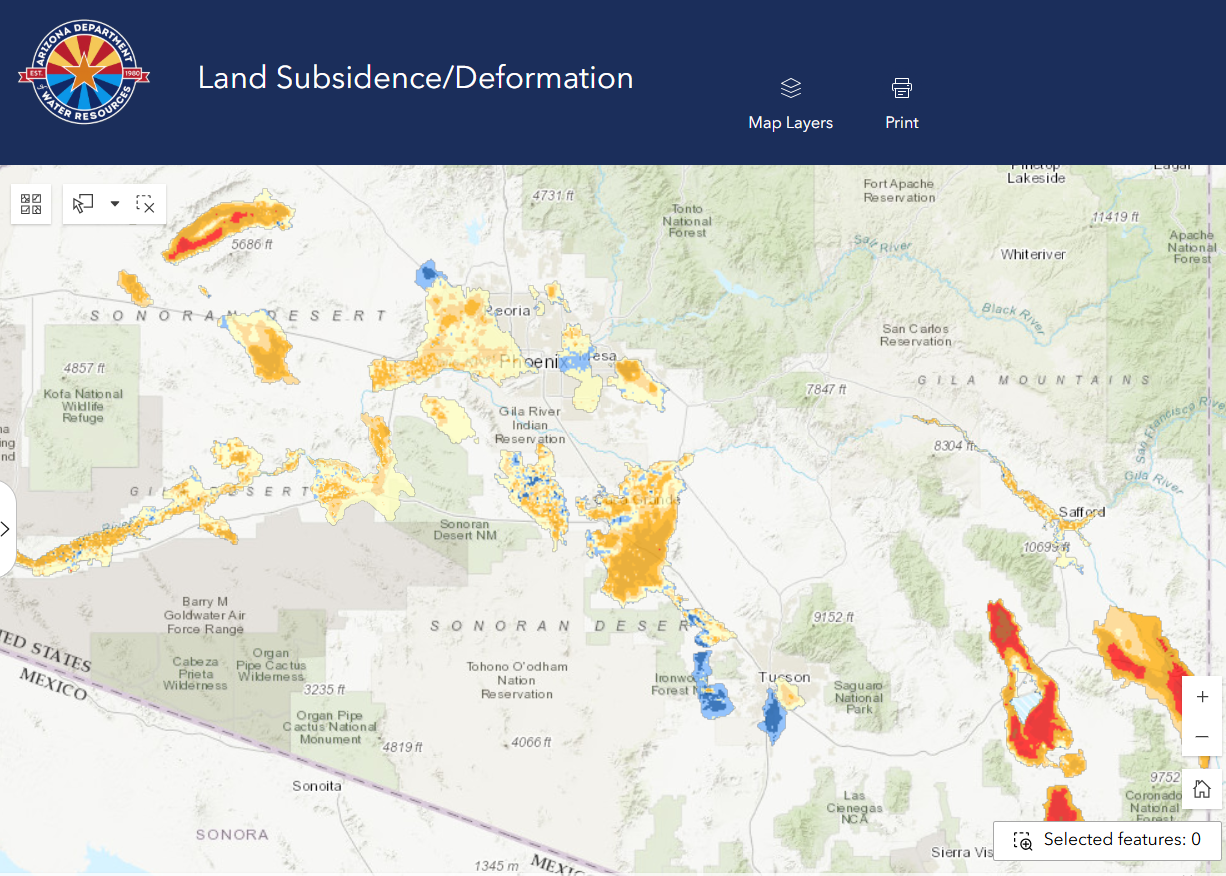
We eventually settled on a format that allowed for the clicking on sites to get their exact data and can be visible at all scales,
said Waltz.
Our GIS Developer, Somu Rapaka, took the lead on this to give that ‘familiar look’ to the application that our users in the public have become familiar with. Like all of the other GIS applications, there is always more to do to improve it.
To make it happen, Conway provided the GIS group with a long list of datasets, including data on subsidence, as well as hydrology datasets and data on the locations of wells.
All of these data sets will be updated annually and/or as new data becomes available,
he said.
These datasets provide the end-users (public, researchers, water managers, etc.) with a tool where all this data can be viewed in one location and easily disseminated and start to paint a picture of the groundwater conditions and land deformation around Arizona.