

Latest ADWR “dashboard” presenting data on new Ag-to-Urban Assured Water Supply program
On December 2, 2024, the Arizona Department of Water Resources gave a presentation to the Governor’s Water Policy Council where it announced that it would initiate an informal stakeholder process to guide the development of potential new rules creating an Assured Water Supply Ag-to-Urban
program.
At that gathering, the Department outlined needed guardrails for a successful Ag-to-Urban program in which water providers in the Phoenix and Pinal AMAs could offer home development a viable pathway to create neighborhoods that reduce groundwater use with the help of existing agricultural groundwater rights.
The goal of the Ag-to-Urban concept is to allow voluntary conversion of unreplenished, high water use Irrigation Grandfathered Rights (IGFRs) to low-water urban uses under the consumer protections of the Assured Water Supply (AWS) Program.

The program is designed to address challenges revealed by Assured Water Supply modeling projections, while continuing to strengthen the integrity of the AWS program.
At the December gathering, ADWR presented its new interactive dashboard which stakeholders may use to help guide their understanding of how different variables could shape the impact of an Ag-to-Urban program on groundwater supplies. ADWR has also made the dashboard’s underlying data set publicly available.
The Department shared still more details of the new Dashboard at the most recent informal meeting of the Ag-to-Urban program on January 16.
The Ag-to-Urban Dashboard represents the latest effort by ADWR to give the public greater access to its substantial database of information about the condition of Arizona’s underground water supplies.
What the Dashboard is showing right now is a sample of some of the projections that we have been working on to understand the potential future of an Ag to Urban program,
said ADWR Director Tom Buschatzke at that January 16 meeting as staff demonstrated the kinds of information it can provide to users.
The Dashboard provides data on the Phoenix AMA and the Pinal AMA as distinct entities.
The conversion rate and net long-term benefits to the aquifer are AMA specific, said the Director.
It’s going to be different in the two AMAs in Pinal and Phoenix. The health of the aquifer in those two AMAs is very different and the hydrogeology in those two AMAs is very different. We’ve talked a lot about finding the right criteria in each one of the two AMAs.
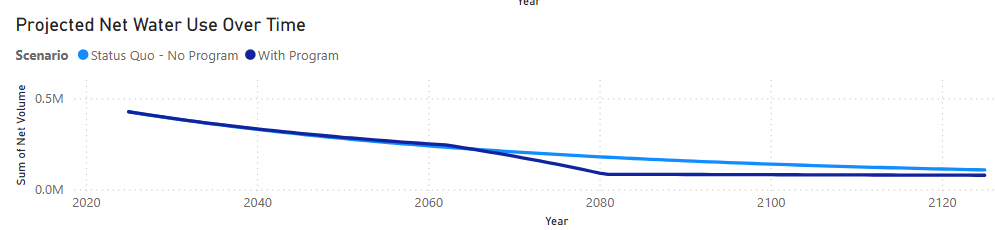
As AMA Director Natalie Mast described at the January meeting, the Dashboard allows a user to select appropriate scenarios or assumptions, which produce charts depicting the status quo compared to program water use over time.

A dashboard graphic can forecast ag water use and ag recharge,
said Mast. The same with industrial use. It also graphically presents net water use over time.
Similarly, it also has a chart showing program-level projections, which will change depending on what you select indicating conversion rate and the replenishment assumptions.
The Dashboard also includes a downloadable dataset in an Excel format.