

Redesigned Drought.gov: A “One-Stop Resource” For All Things Drought
By Kelsey Satalino, NOAA
Arizona is no stranger to drought. Officially, the state has seen some level of drought at least since 2002, and likely well before that. At present, the drought is considered to be especially severe. Last year, 2020, was the second driest calendar year on record for the state and the driest since 1956. In addition, statewide precipitation was 2.08 inches below average for the water year through January, making it the 14th driest water year on record so far. Not surprisingly, effective drought monitoring, forecasting, and planning are especially important in times such as these.
The National Oceanic and Atmospheric Administration’s National Integrated Drought Information System (NIDIS) has been providing resources, maps, and tools for drought decision makers through the U.S. Drought Portal, or Drought.gov, since 2008. In January, NIDIS launched a major redesign of Drought.gov to better serve stakeholders, decision makers, the media and the public.
The new website features updated content and new interactive architecture designed to provide actionable, shareable information and easy-to-understand graphics. That new website describes current drought conditions and forecasts by city, county, state, and at watershed to global scales. Drought.gov also aggregates and presents drought impact data for economic sectors such as agriculture, water utilities, and wildfire management using interactive maps and data that don’t exist anywhere else.
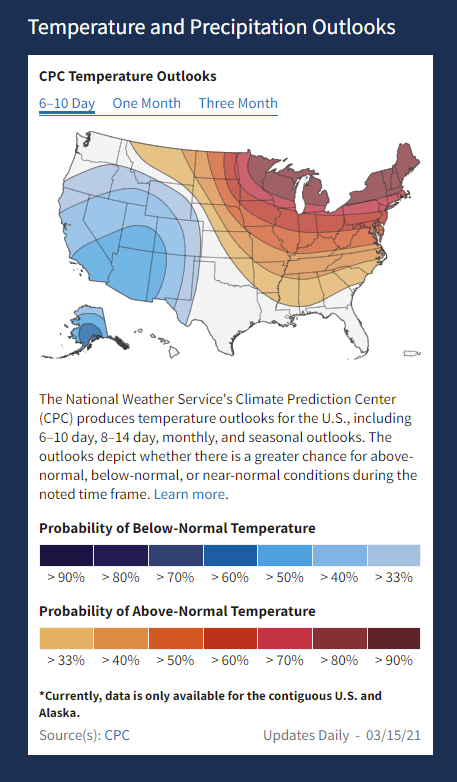
Need to find the latest drought status? The website’s “Data and Maps” section provides up-to-date drought-status reports. There, you can get national drought conditions, impacts, and outlooks, as well as drought-related maps for temperature and precipitation, water supply, snow drought, wildfires, and more.
The new U.S. Drought Portal has four key new features:
- Drought conditions down to the city and county level, including current conditions, key indicators of drought, outlooks and forecasts, water supply impacts, historical drought conditions, and more. You can also access curated lists of drought early warning resources for Arizona and the entire Intermountain West.
- Historical data and maps, including an interactive map where you can compare three historical drought datasets side by side down to the county level: U.S. Drought Monitor data going back to 2000, Standardized Precipitation Index (SPI) data going back to 1895, and paleoclimate data (e.g., from tree-ring analysis) going back to the year 0 for some regions of the U.S.
- By Sector section, which shows drought impacts on different economic sectors, such as agriculture, energy, water utilities, and tourism and recreation.
- Research and Learn section where you can “go back to the basics” on drought with definitions, overviews of different types of drought such as flash drought and snow drought, and learn about initiatives like the National Coordinated Soil Moisture Monitoring Network.
Have questions or feedback? Let NIDIS know how the new Drought.gov is serving you, how you use drought-related information in decision making, and/or what other resources you would like to see available by emailing [email protected].
Article courtesy of Kelsey Satalino from the National Oceanic and Atmospheric Administration